Univariate Analysis
After preprocessing, one can perform a subject-specific fMRI analysis (first-level) or look at group effects (second-level), which encoporates data from multiple subjects. One way to do this is to use a mass-univariate analysis, the standard procedure in fMRI processing. Hereby we want to find task-related activations in each voxel. That is, we are interested in the correlation between stimulus presentation and the timeseries of a voxel. In order to find these correlations we create a model of timeseries we expect for our given stimuli. To make this model as accurate as possible, we do not only include our stimuli onsets and durations but also noise that we expect to occur. These model predictors are also called regressors and can be convolved with the hemodynamic response function (HRF) to generate a more natural-looking timeseries model.
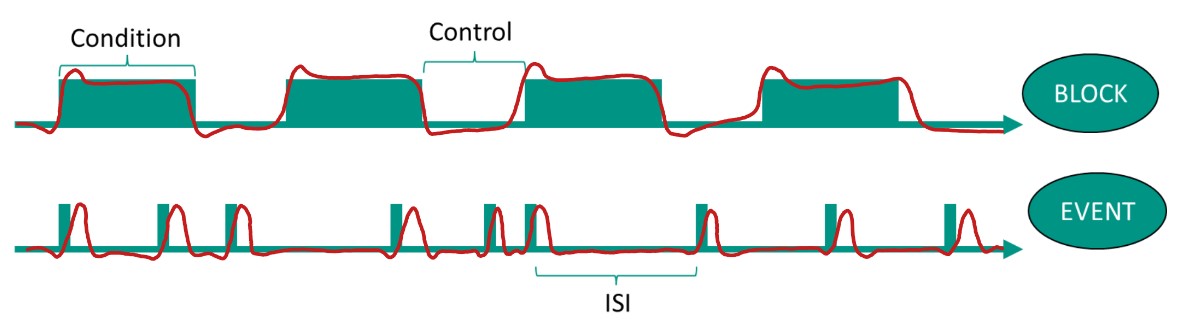
Fig.1: Blocked and Event-related Design Regressors for one condition. Green box-car functions are convolved with the HRF.
Once we have chosen the model regressors we can estimate the contribution each regressor makes to our model. We thus calculate the influence of each single regressor by comparing the model to the actual timeseries. Mathematically speaking, this process is described in a GLM (General Linear Model) where the actual timeseries are represented as the regressors together with their influence and the residual noise . To best fit the regressors to the actual timeseries, we adapt the regressor's influence accordingly. This is done by minimizing the difference between the two (finding the minimum of the derivative).
For each voxel we get values that represent the contribution each condition/regressor has on the voxel timeseries. Unfortunatly, the values across voxels cannot be directly compared, they need to be normalized first. Therefore, statistical inference (often in form of a p or F-test are preformed on each voxel). To do so, one or a combination of beta values are selected for testing. This is what we call setting a contrast. Depending on the selected test and contrast, we retrieve a test-map where each voxel represents the effect strength of the specific statistic.